
Analysis of Immigrant Flows and Stocks in Finland
- #Projects

This project focuses on analyzing and visualizing immigrant flows and stocks in Finland using Tableau to uncover trends, patterns, and insights. The dynamics of immigration are influenced by a multitude of factors, including economic, demographic, socio-cultural, and political elements, among others.
Media coverage often exaggerates global migration, leading to misconceptions. In reality, migration rates have remained stable over the past 30 years, with about 4% of the world's population living in a country different from their birthplace. Visa restrictions and financial constraints hinder most people from moving. Migration patterns vary significantly between countries, ranging from 15% in high-income nations to around 2% in Asia, Africa, and Latin America.
Population ageing in Finland
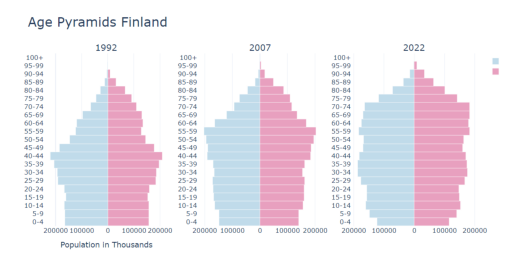
The 1992 pyramid shows a relatively balanced distribution, but by 2007, the base starts to narrow, reflecting lower birth rates. By 2022, the pyramid further accentuates an aging population, with a noticeable bulge in the upper age groups, indicating a significant increase in the elderly population and a shrinking younger demographic, signaling challenges for future workforce sustainability and increased pressure on healthcare and pension systems.
It's intriguing to ponder the proportion of immigrants in the overall population. Here is the link to the Tableau Dashboard. An animated version is here:
For 30 years, we can see how immigrants fill in the main sections of the working-age population. In 1992, the migrant population is minimal, but by 2007, there is a noticeable growth, particularly in the working-age groups. By 2022, migrants constitute a significant portion of the younger and middle-aged population, suggesting their growing importance in offsetting the effects of an aging native population and contributing to the labor force and demographic balance in Finland.
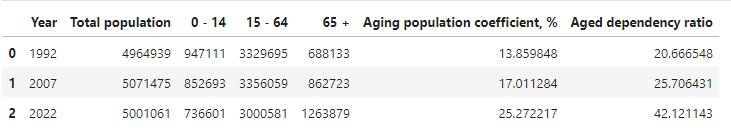
These trends are particularly significant given Finland's flexible retirement age (64-68 years) for earnings-related pensions and a fixed age of 65 for guaranteed pensions. When comparing datasets with and without immigrants, the impact of immigration becomes even more evident: without immigrants, the percentage of people over 65 years old would increase from 14% to 25%, and the aged dependency ratio would rise from 21% to 42%, underscoring the critical role of immigration in mitigating the challenges of an aging population.
Here is the real data with migrant stocks in Finland:
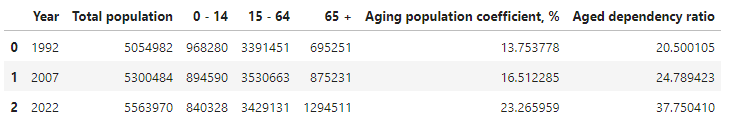
Over the past 30 years, the percentage of people over 65 in Finland has risen from 14% to 23%, and the aged dependency ratio increased from 21% to 38%.
Economists use this ratio to analyze how demographic changes impact economies, with working-age individuals contributing most to the economy and taxes. Societies with high dependency ratios may face challenges, while those with lower ratios are considered better off. Migration is one factor affecting the dependency ratio. Rapidly aging populations create a shortage of qualified workers, leading some countries to turn to immigration to maintain a well-supplied labor force. As we can see migrant stocks improves the situation with aging population.
It is also important to distinguish between migrant stocks and migration flows. These numbers are so-called “absolute indicators of migration”. They show how many migrants reside in a country as of a given date, i.e. at a certain moment, and how many migration events or procedures associated with migration have occurred within a period of time.
Migration is a powerful driver and consequence of change, but measuring it accurately with big data remains a challenge. Differentiating between migration and short-term mobility is unclear, making it difficult to identify true migrants from the data.
Misconceptions
A common misconception is that immigrants solely rely on unemployment benefits and do not work. However, the unemployment rate for people of foreign origin is only about 5-10% higher than for those of Finnish origin (Source: kotoutuminen.fi). Another misconception is that immigrants contribute to higher crime rates. Yet, data on individuals suspected of and charged with offenses in Finland during 2022 presents a more nuanced picture:

Suspected Offenses:
- Share of suspected immigrants from migrant stocks: 5.46%
- Share of suspected individuals of Finnish origin: 5.65%
Migrant stocks and flows analysis
Let's have a look at migrant stocks in Finland from 1990 to 2022. You can explore this in detail through the interactive Tableau dashboard, which provides a comprehensive visual representation of the changes in international migrant stocks over this period.
This screenshot gives you an overview of the dashboard's visual insights. The interactive version allows you to dive deeper into specific trends and data points, such as filtering by year, region, and migrant demographics.
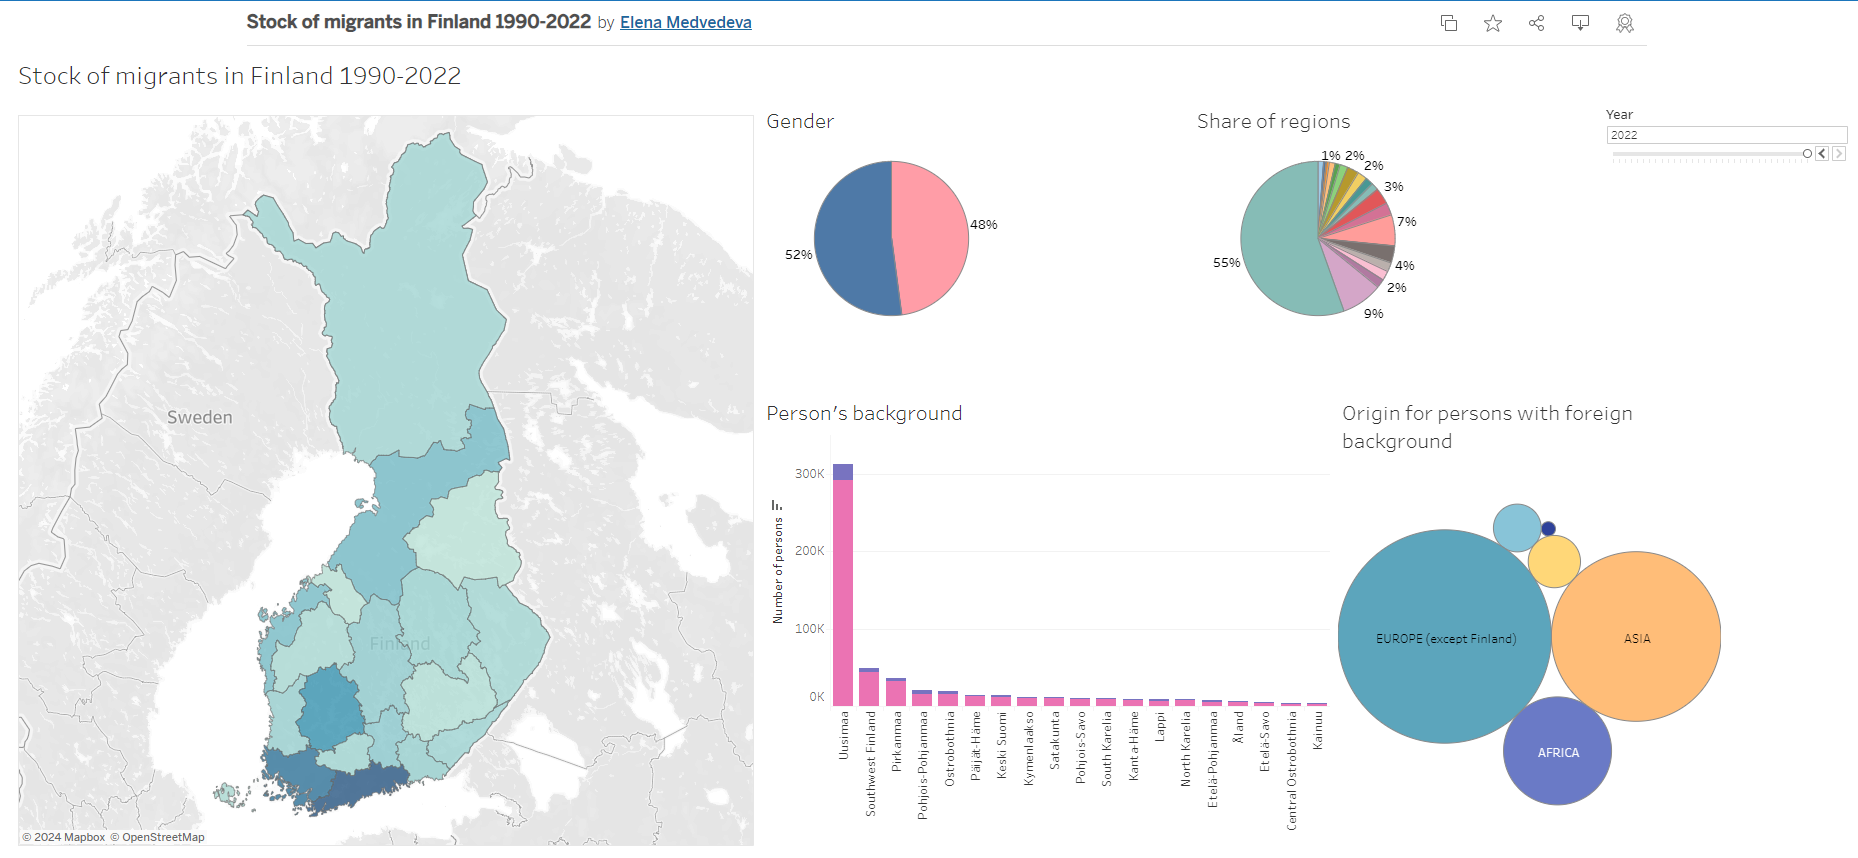
Over the past 30 years, Finland has experienced a remarkable eight-fold increase in its migrant population. Notably, the Uusimaa region has seen a dramatic rise in migrant numbers, growing from 37% in 1990 to 55% in 2022, establishing itself as the leading region for migrant settlement. Southwest Finland and Pirkanmaa follow as the second and third highest regions, respectively, with Pohjois-Pohjanmaa and Ostrobothnia also showing significant migrant presence.
Throughout these three decades, the gender distribution among migrants has remained relatively stable, reflecting a consistent balance. Initially, the majority of migrants came from Europe, accounting for 59% of the total, with Asia contributing 14%. Today, the distribution has shifted, with Europe now representing 50% and Asia increasing to 32% of the migrant population.
Additionally, you can explore migrant flows to Finland in the interactive dashboard on migrant flows from 1990 to 2021. This tool allows you to track the growth and changes in migration patterns, providing deeper insights into where migrants are coming from and where they are settling.
The screenshot above provides a snapshot of the dashboard’s visual representation of migrant flows. By using the interactive version, you can explore more details and examine specific trends, such as the increase in migration flows over the last three decades.
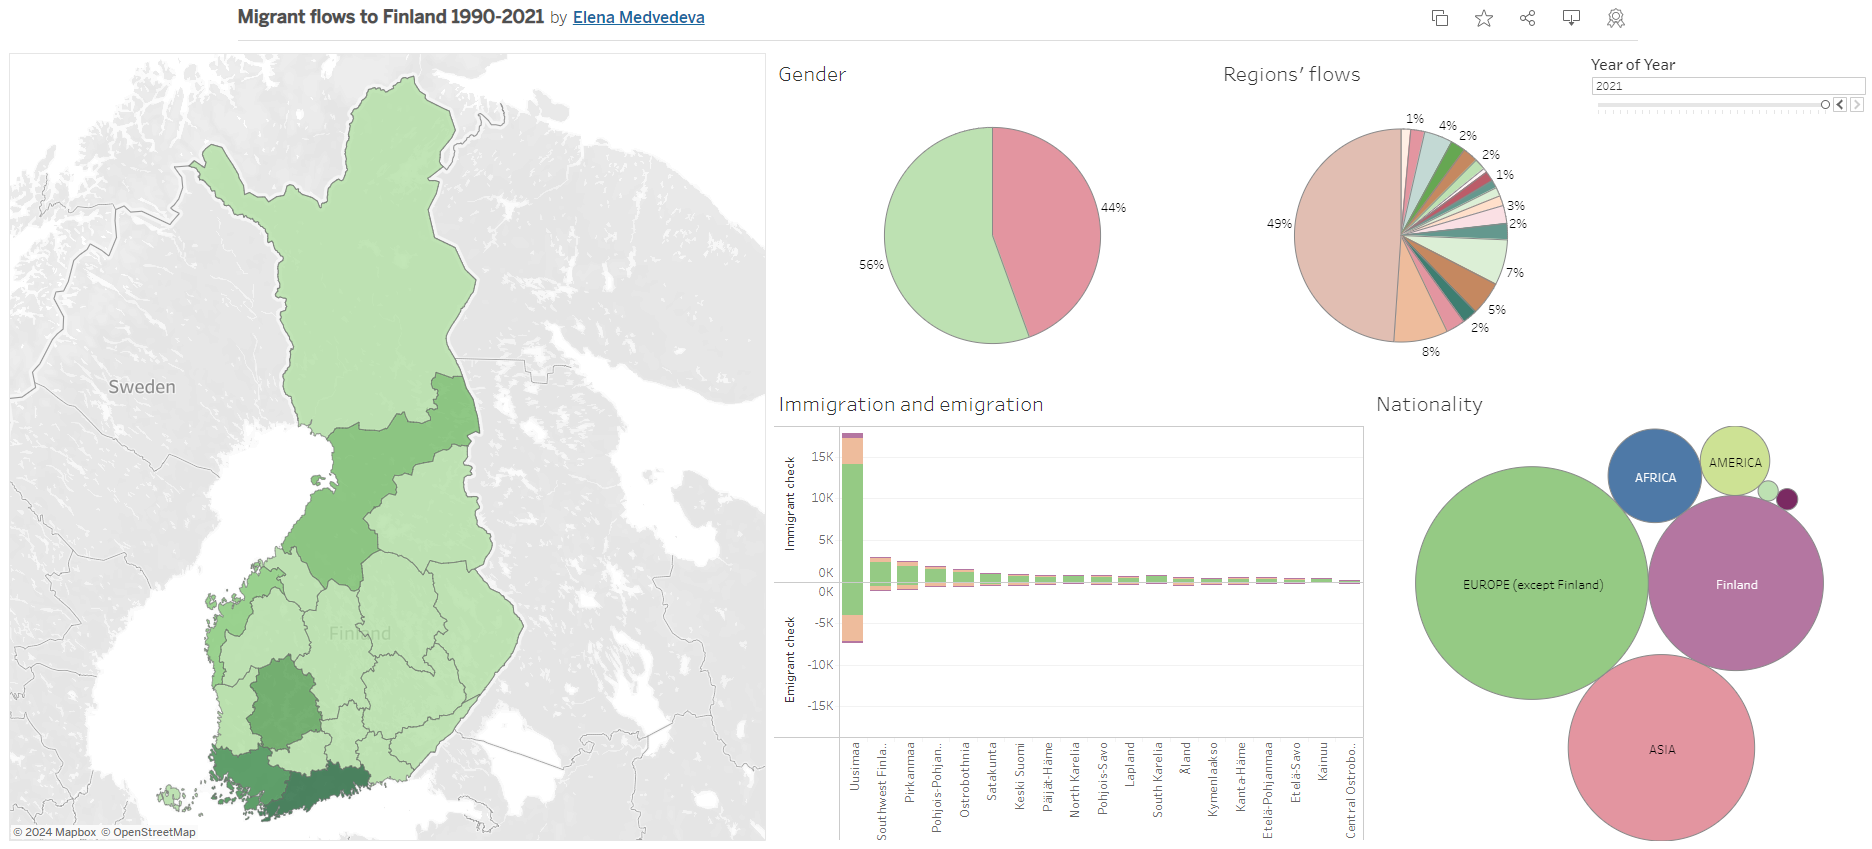
Migration flows to Finland have experienced remarkable growth, nearly tripling in size over the past three decades. While the proportion of immigrants with Finnish heritage has remained relatively stable, those with foreign origins have seen a striking five-fold increase.
Significant migration has been directed towards the Uusimaa region, which has become the primary destination for newcomers. In 1990, Southwest Finland ranked second in migrant inflows, followed by Pirkanmaa and Lapland. Initially, immigrants with Finnish backgrounds were the majority, but from 2006 onward, European immigrants began to dominate the influx. By 2021, a substantial portion of immigrants originated from Asia. Throughout this period, the gender distribution among migrants has remained consistently balanced, reflecting a stable trend. Additionally, emigrant flows from Finland have doubled.
Comparison of Finland with Other Countries
Here is an animated Visualization of the Top 20 Finnish citizenships granted according to previous nationality, 1990-2022. It provides a dynamic view of how citizenship trends have shifted over time:
In the early years, most immigrants granted Finnish citizenship were originally from Sweden, reflecting the historical ties between the two countries. However, as the years progressed, new patterns began to emerge. By the 2000s, Russia, Somalia, Estonia, and Iraq became more prominent, rising to the top of the list. This shift indicates Finland’s evolving role in global migration, attracting a more diverse population from regions outside of its immediate neighbors.
The next interactive dashboard illustrate the ratings among developed countries and European nations (excluding microstates) from 1990 to 2020. It focuses on the percentage of international migrant stock relative to the total population.
You can explore the data in more depth through the interactive dashboard, where you have the option to select specific countries or regions and observe how the migrant stock as a percentage of the population has evolved over time.
This screenshot provides a visual snapshot of the dashboard. The interactive version allows you to customize the view, filtering data by year, country, or region to see more specific trends and comparisons.
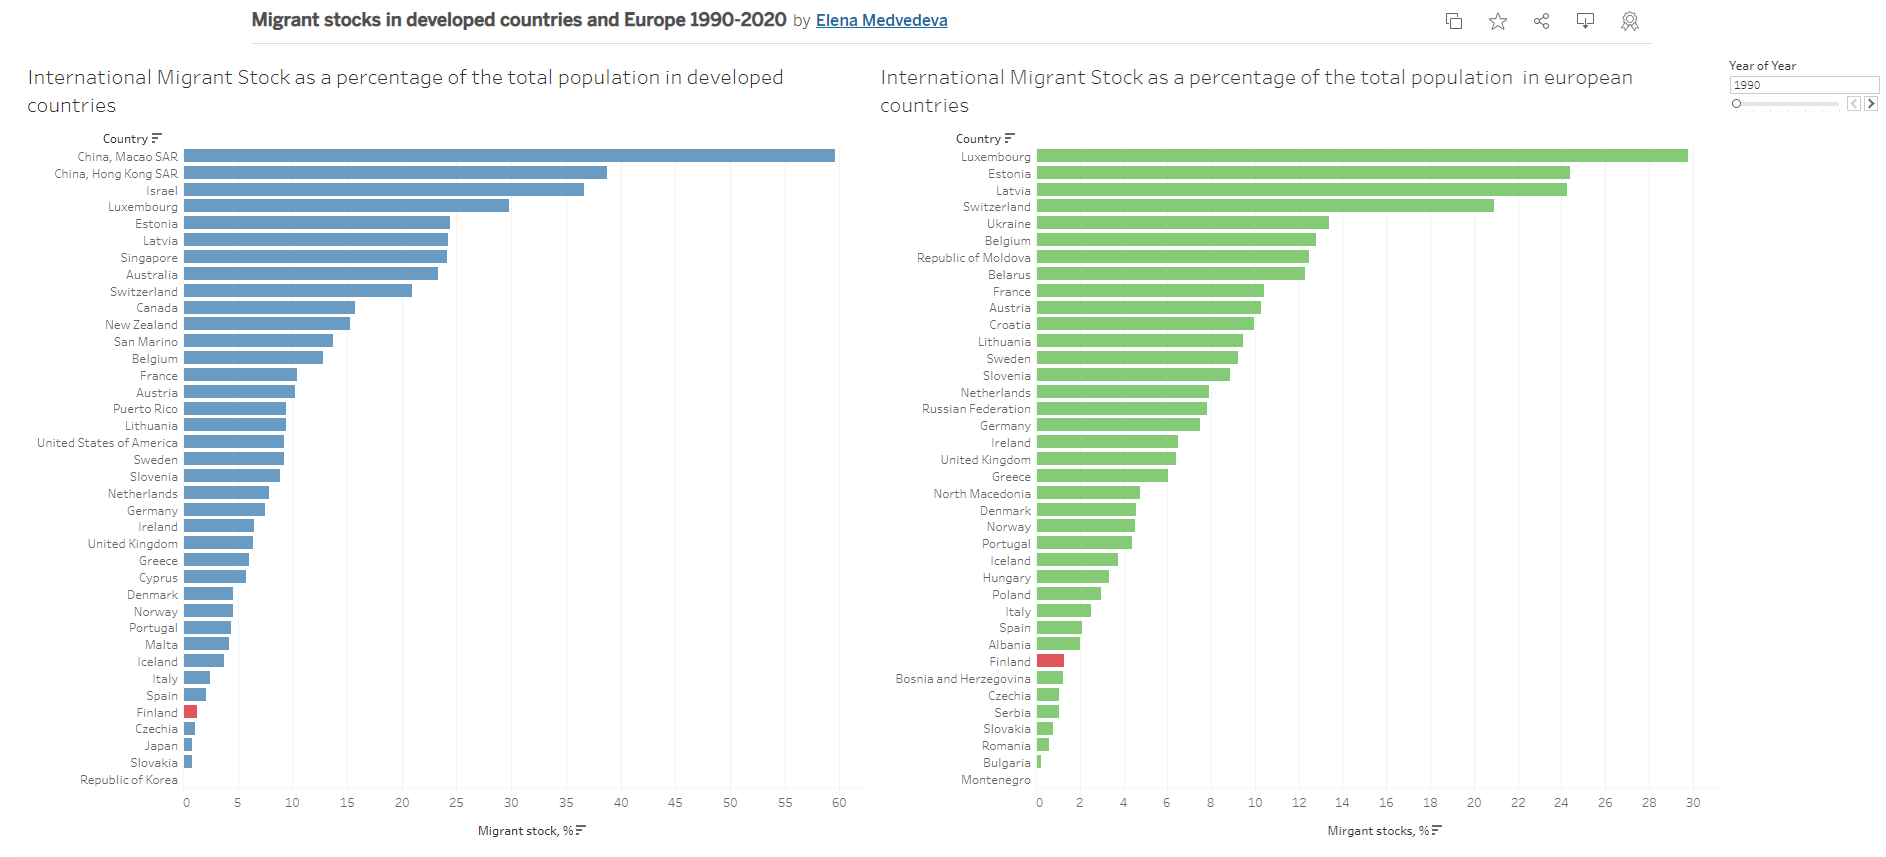
In 1990, Finland ranked 34th among developed countries, improving to 33rd by 2020. Within Europe, Finland's position advanced from 31st in 1990 to 26th in 2020.
In contrast, Sweden experienced more significant changes. It ranked 19th among developed countries in 1990 and surged to 11th place by 2020. Within Europe, Sweden climbed from 13th in 1990 to 3rd in 2020.
Over the past three decades, Finland has shown modest improvements in international rankings, while Sweden has experienced dramatic gains. Finland's gradual rise reflects steady progress, whereas Sweden's significant advancement highlights its rapid growth and increased prominence among both developed and European countries.
Conclusion
The analysis of immigrant flows and stocks in Finland over the past three decades reveals a dynamic and evolving landscape. While Finland has made gradual progress in accommodating and integrating immigrants, the data underscores the significant role that migration plays in addressing the challenges posed by an aging population. The steady increase in the migrant population, particularly in working-age groups, has helped mitigate the demographic pressures associated with a declining native workforce and a rising dependency ratio.
The regional variations, with Uusimaa emerging as a primary hub for immigrants, further highlight the importance of local economic and social factors in shaping migration patterns. The shift in the origins of migrants, with increasing numbers from Asia, reflects broader global migration trends and the growing interconnectedness of Finland with diverse regions of the world.
However, this growth also comes with challenges. Misconceptions about immigration, such as its impact on unemployment and crime, continue to persist despite evidence to the contrary. Addressing these misconceptions is crucial for fostering a more informed and inclusive public discourse on immigration.
In comparison to other developed and European countries, Finland's progress in terms of international migrant stock is modest but steady. While Finland has advanced in global and European rankings, it lags behind its Nordic neighbor Sweden, which has seen more dramatic changes in its migrant population and international standing.
Looking forward, the continued success of Finland's approach to immigration will depend on its ability to balance the benefits of migration with the need to address social and economic integration challenges. You can find the full project on my GitHub here.
Data source:
- Statistics Finland (stat.fi)
- United Nations (https://www.un.org/en/)
- United Nations Economic Commission for Europe (UNECE) (unece.org)